





Centralise, understand and steer your digital marketing data
A single, secure and customisable interface bringing together your ad platforms, your web analytics and your e-commerce back-office — updated every day.
Reply within 24 working hours
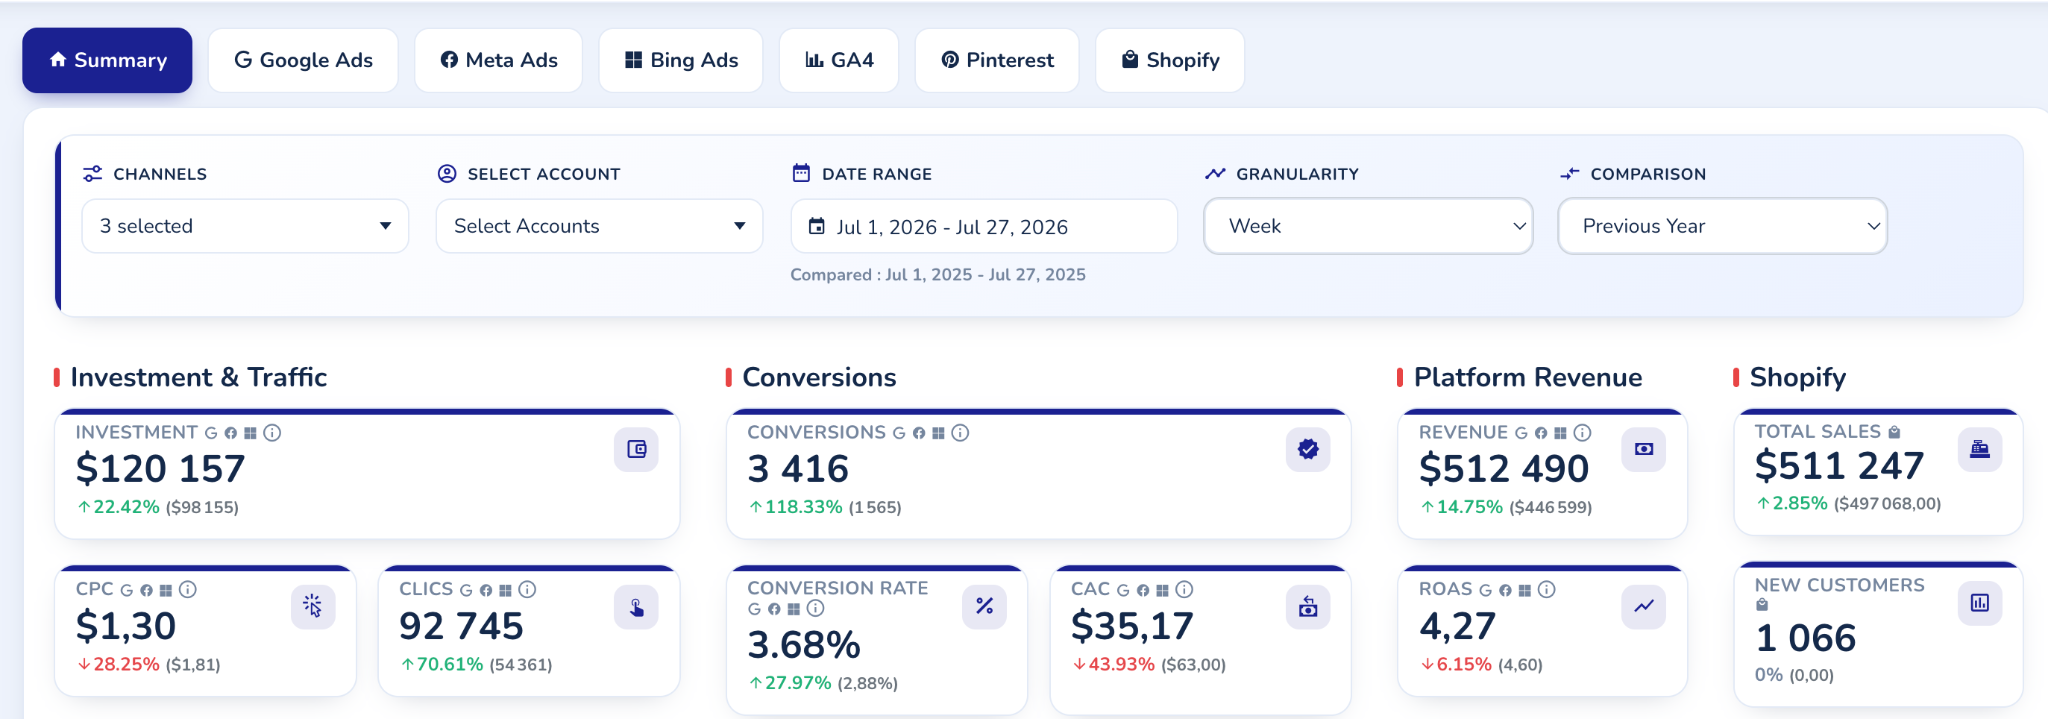
6 channels
Google, Meta, Bing, TikTok, LinkedIn and Pinterest tracked in a single interface
Daily
All data refreshed from each platform's official API
Tailored
A reporting scope defined with you, around your stack and your objectives
They trust us



Why centralising your data changes the business decision
Every ad platform measures its own performance with a structural incentive to over-attribute the sale. Added together, the revenue reported by the platforms often exceeds the revenue actually banked — which is impossible.
Google Ads, Meta Ads, Pinterest Ads...
Useful for day-to-day steering — always biased in favour of the channel, never the source of truth.
GA4, Piano Analytics, AT Internet...
Total revenue and contribution per channel, generally measured post-click.
Shopify, PrestaShop, Magento...
The revenue actually banked.
A real client example: two views of every channel
Real case, June 2026 — within a single month, the gap between the ROAS reported by the platform and the real ROAS ranges from ×1.7 to over ×25 depending on the channel.
| Channel | ROAS reported by the platform | Real ROAS (GA4 / blended) | Gap |
|---|---|---|---|
| Meta Ads | 4.6 | 1.34 (all in, including store traffic) | ×3.4 |
| Google Ads | 5.2 | 3.1 (GA4 post-click; 3.7 on the markets managed by Snow Globe) | ×1.7 |
| ≈16.5 (≈€612k reported for ≈€37k invested) | 0.4 (≈€15k of revenue attributed in GA4) | ×25 on revenue |
Sources: Meta Ads, Pinterest Ads and Google Ads interfaces; GA4 reports, June 2026 (Prospect x Snow Globe document, July 2026). Across the 50+ Meta and 50+ Google Ads accounts we manage, the finding is the same everywhere.
Working from the platform ROAS, this client cut Google Ads investment to reallocate towards Meta and Pinterest. Over the following 7 days, GA4 and the back-office showed a 25% drop in revenue versus last year. A centralised dashboard would have grounded the decision before it cost that much revenue.
- Ad platforms: Google Ads, Meta Ads, Bing Ads, LinkedIn Ads, Pinterest Ads...
- Web analytics: Google Analytics 4, Piano Analytics, AT Internet, Amplitude...
- E-commerce back-office: Shopify, PrestaShop, Magento — the client's real data
- Customisation: no limit on providers, the platform adapts to your stack
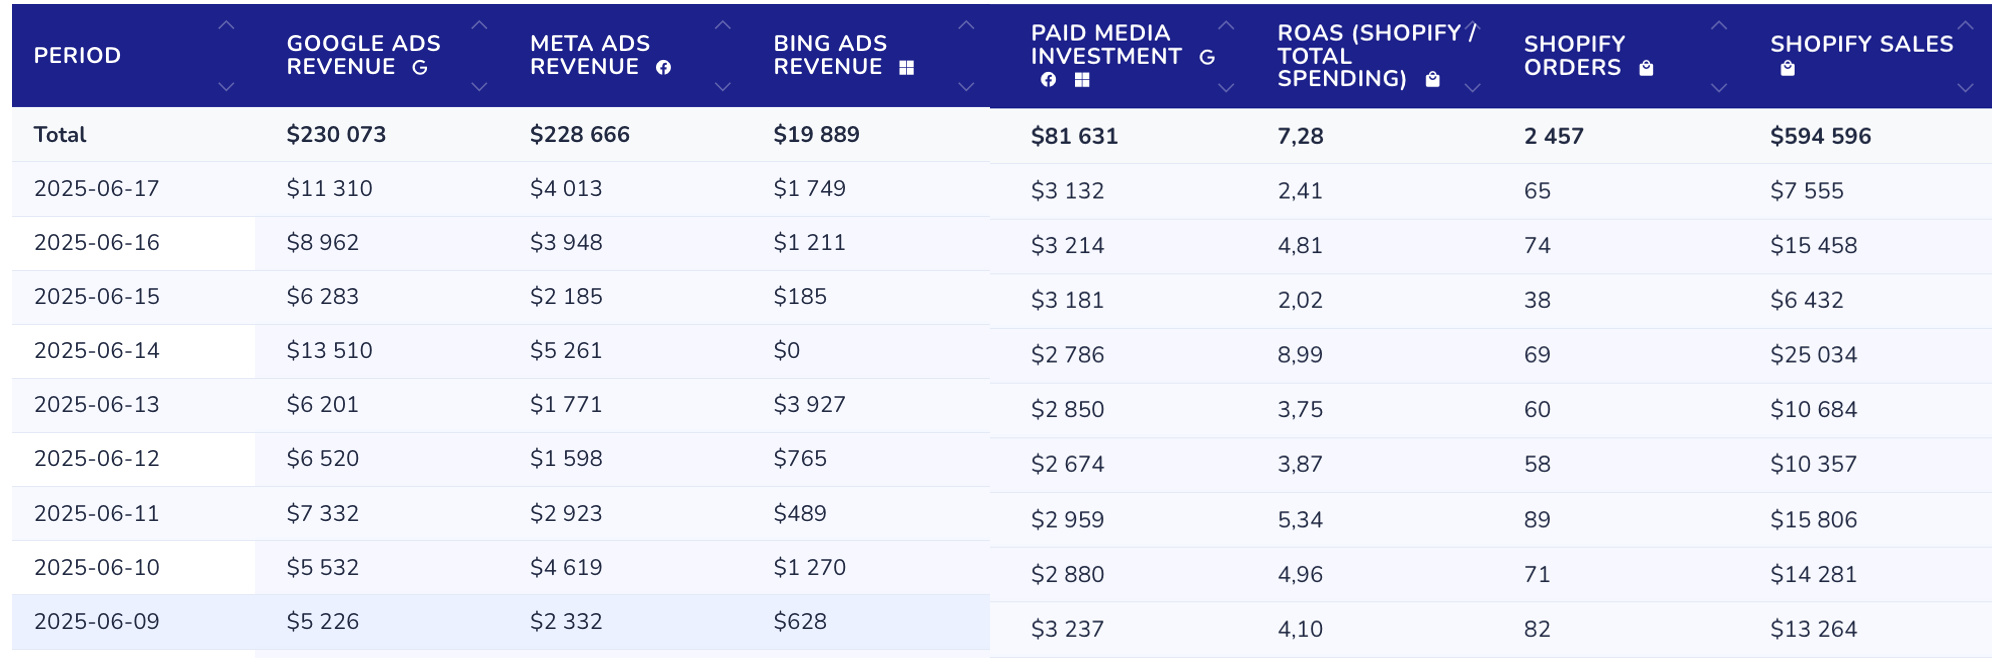
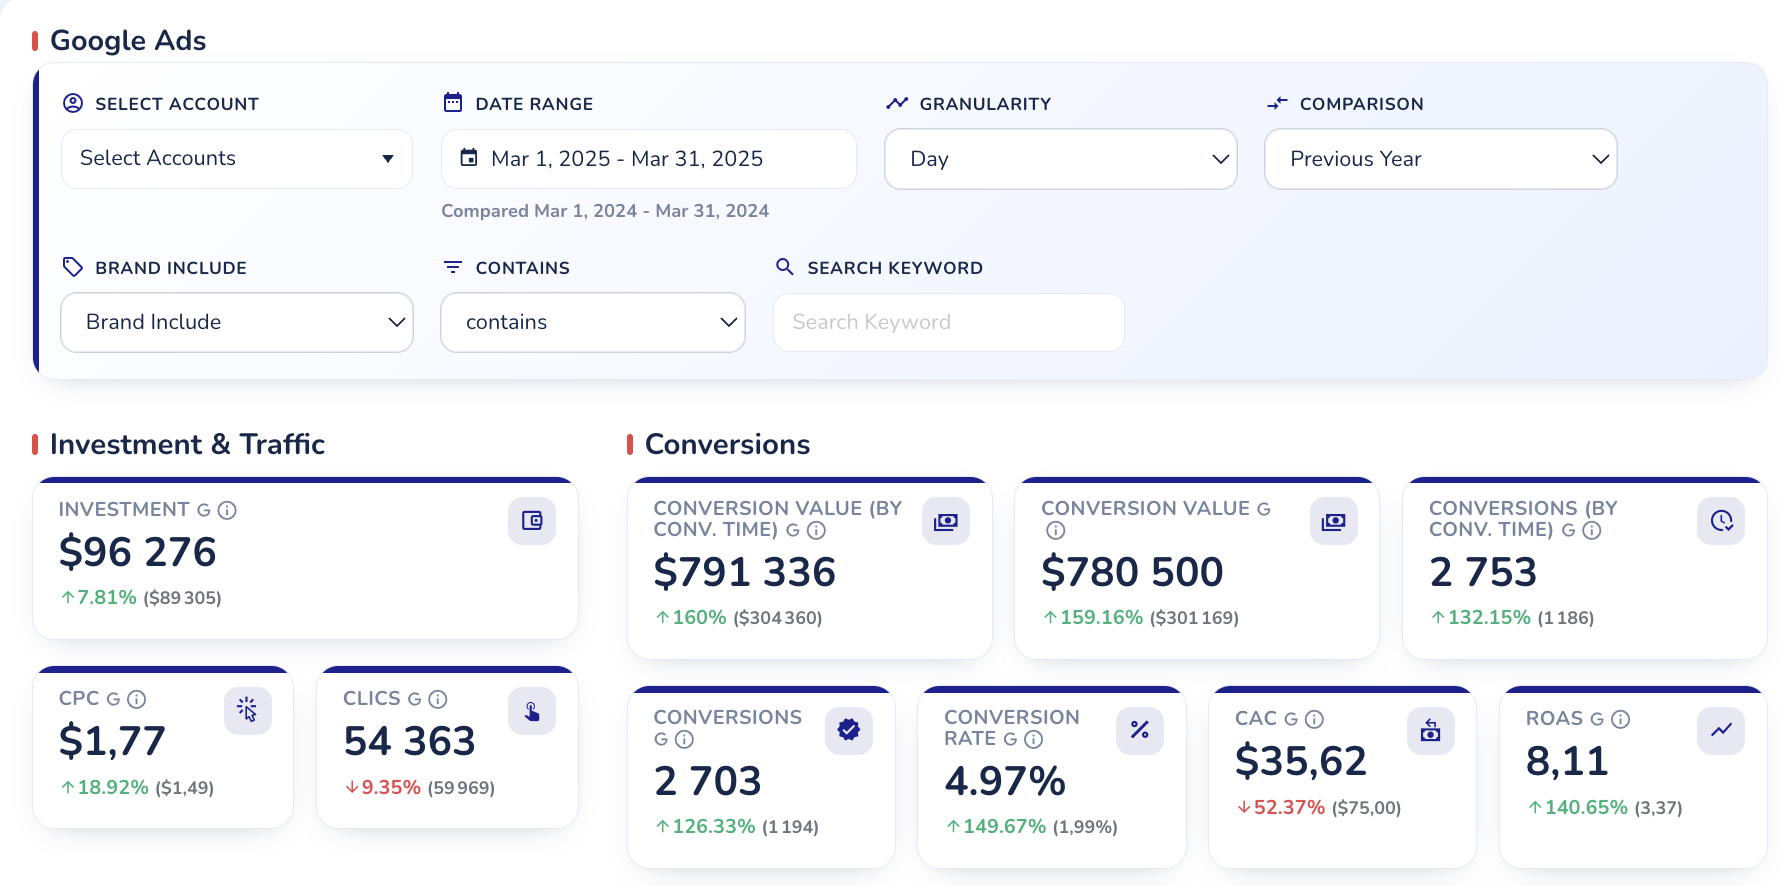
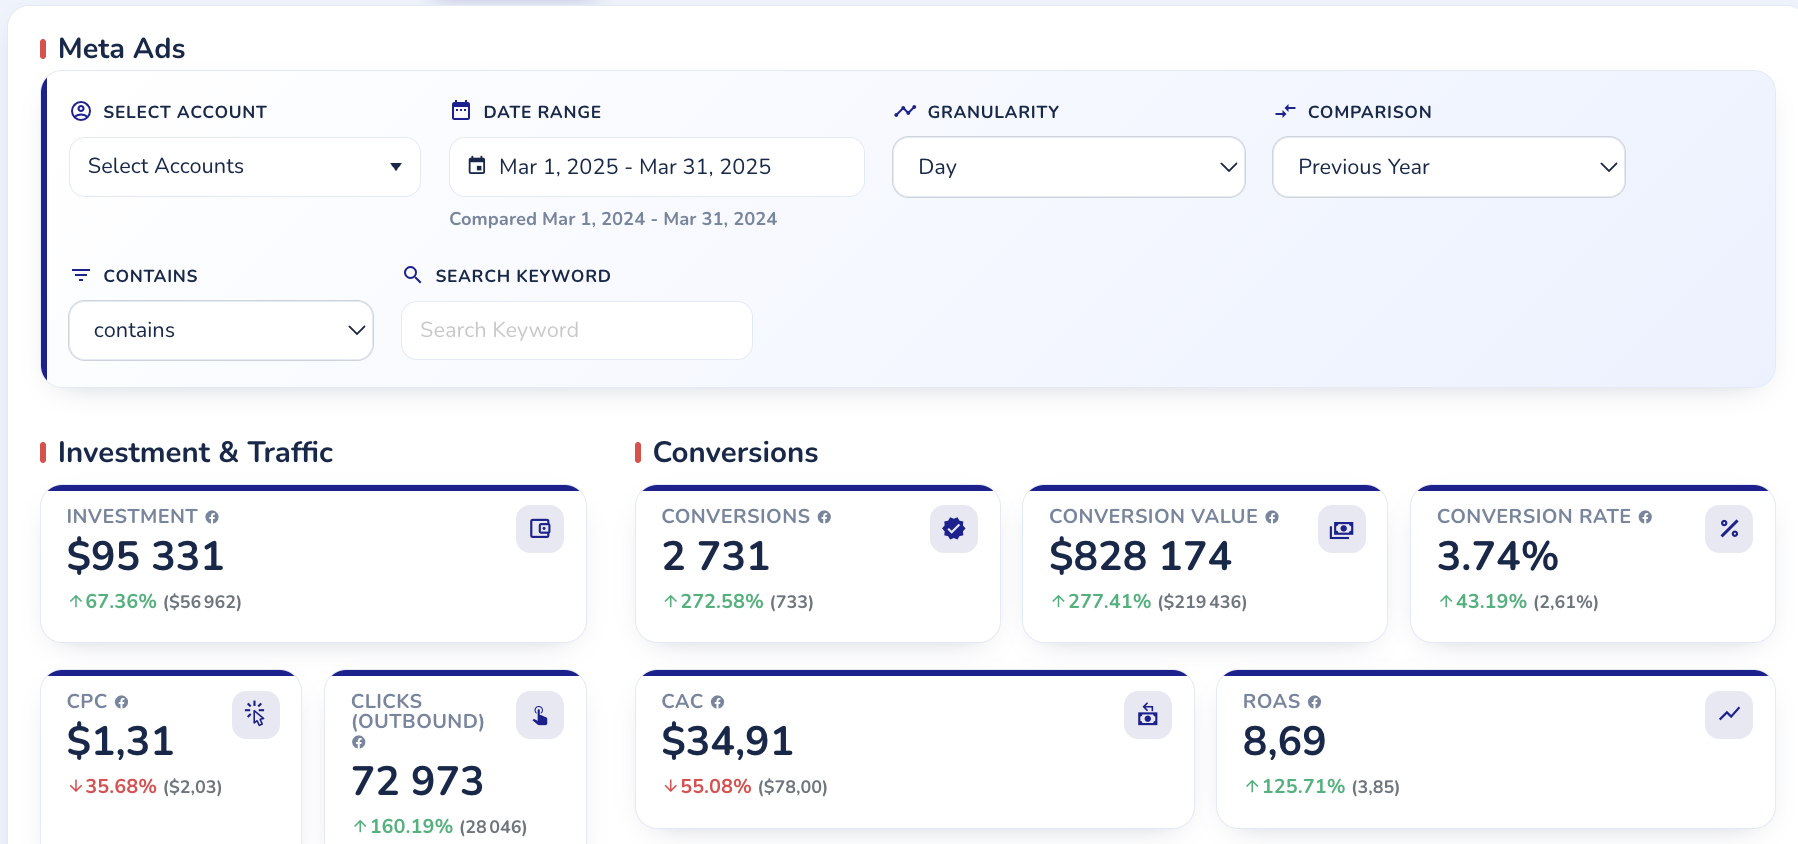
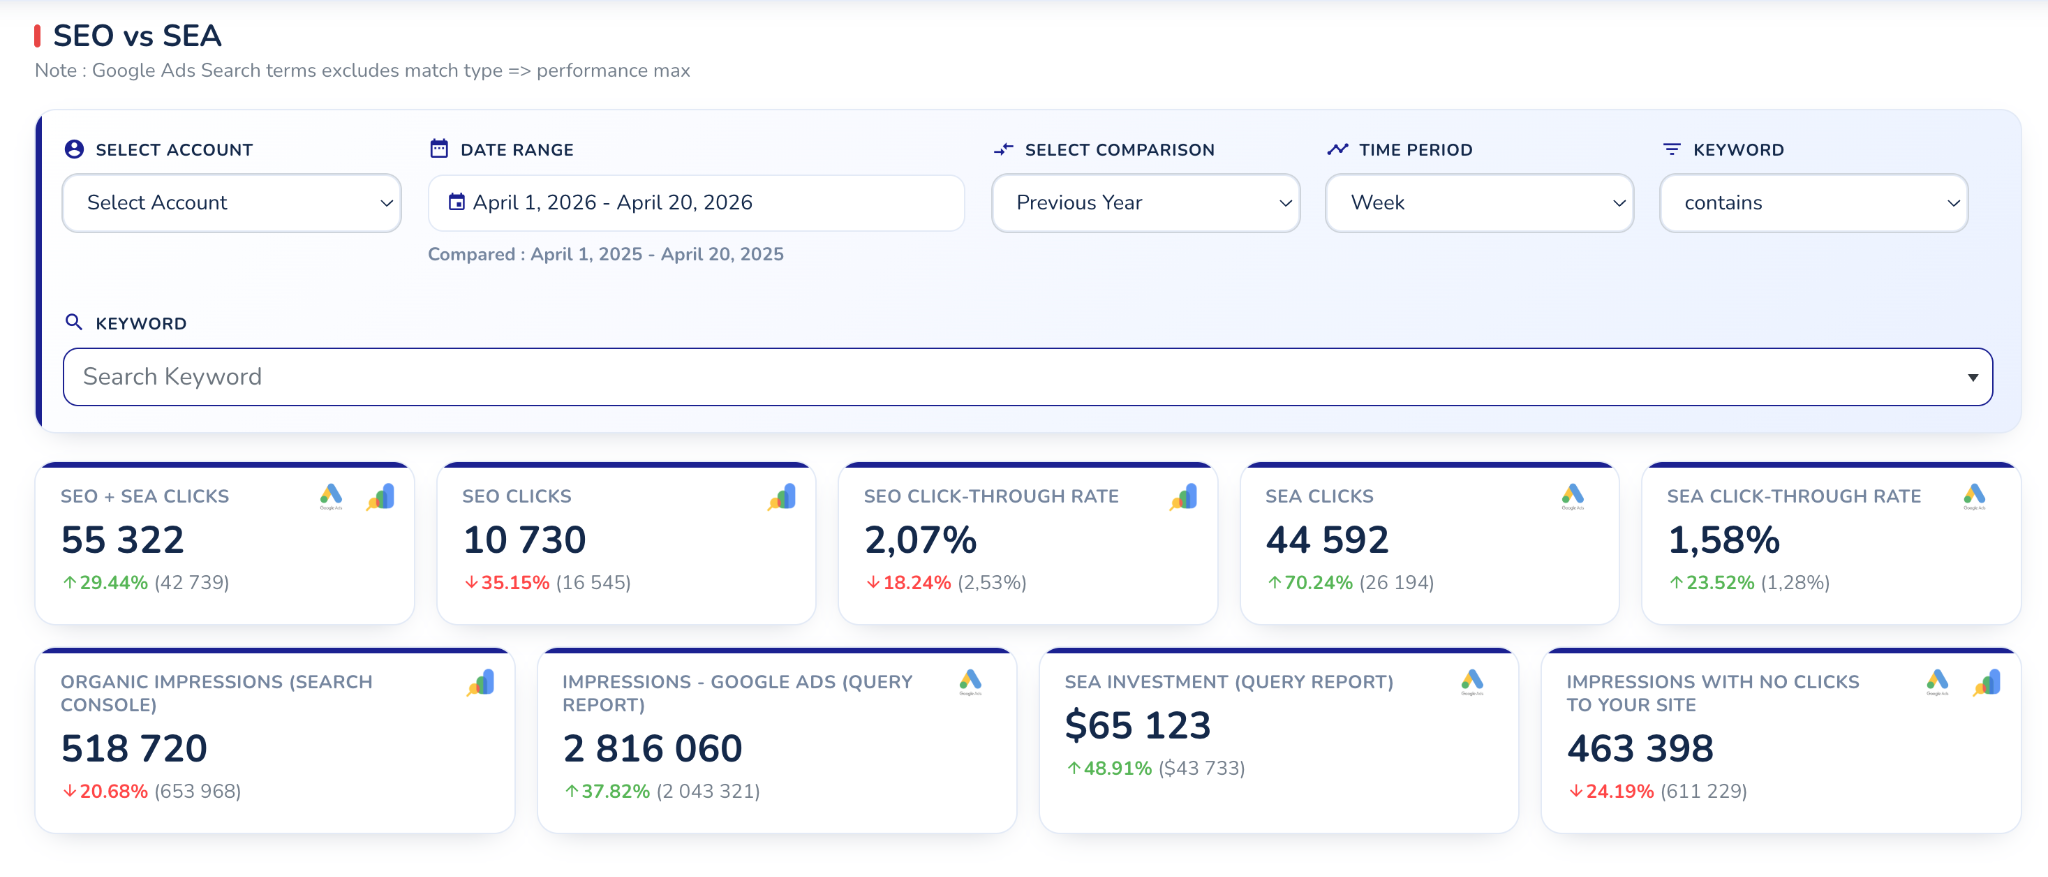

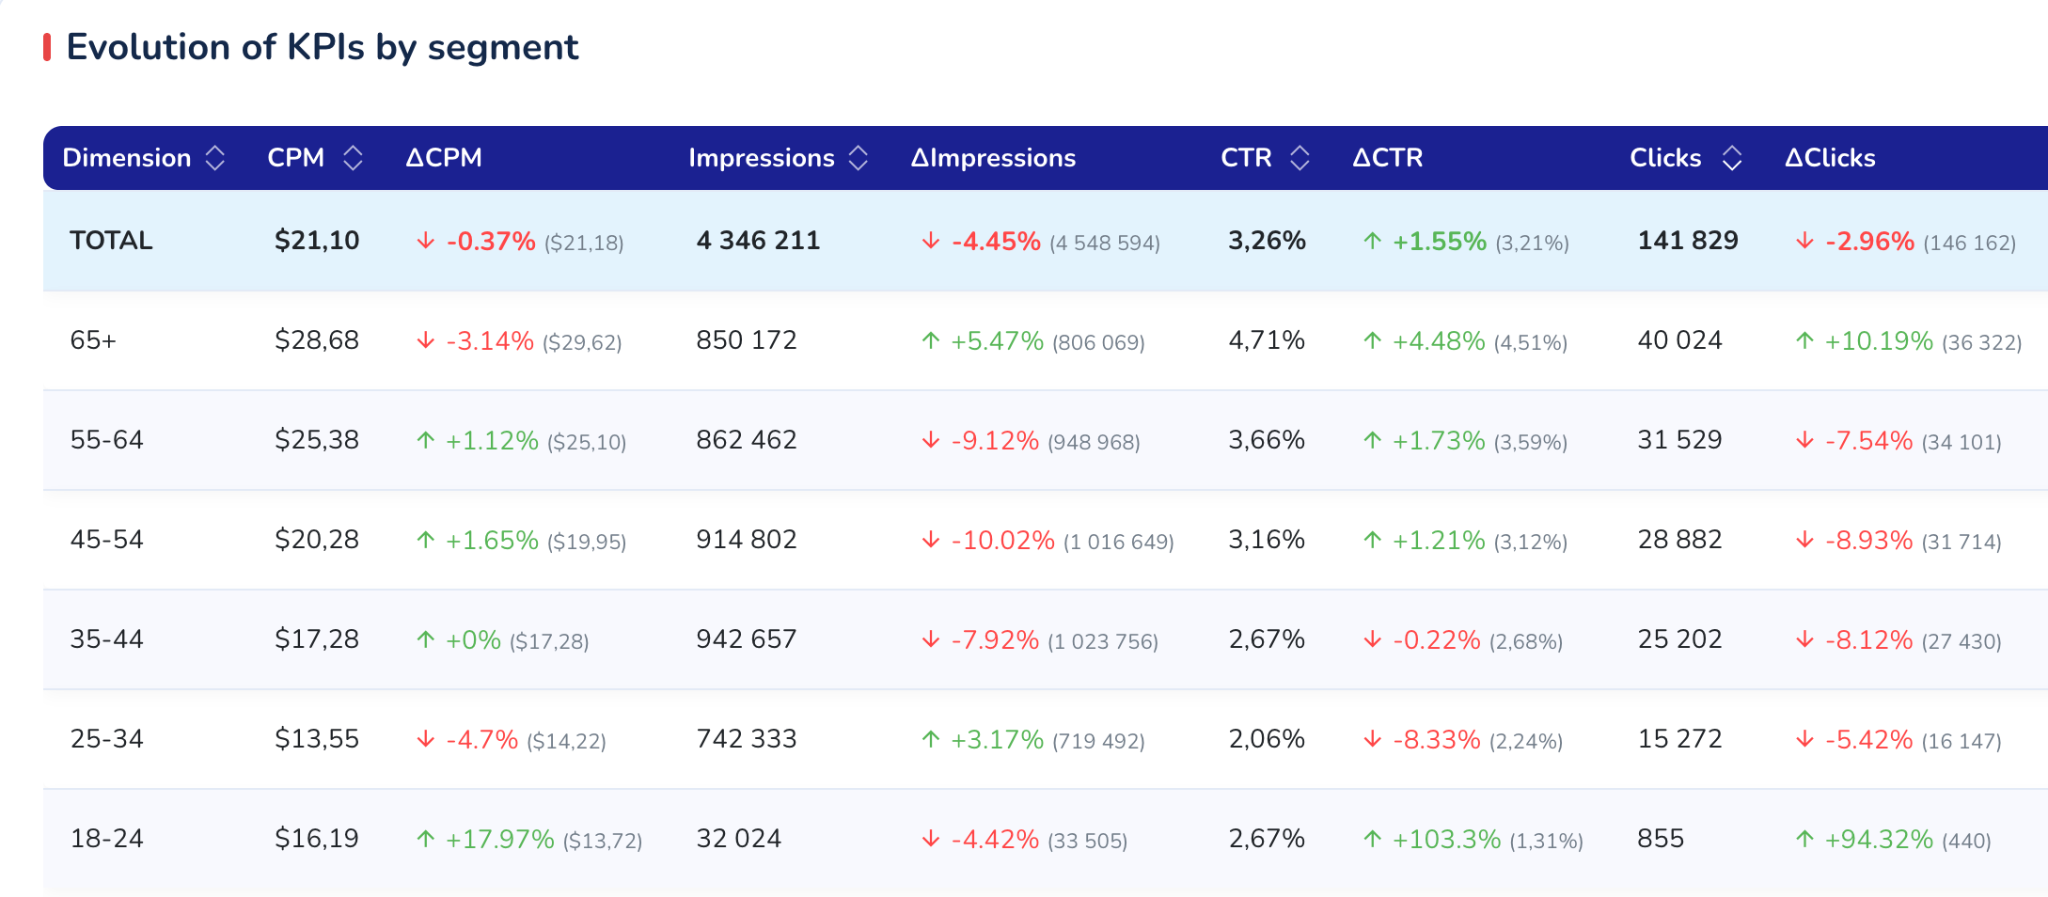
A standard platform, bespoke reports
The reporting scope is defined with you, based on your stack, your objectives and the engagement in place. Beyond the core platform, we build additional reports tailored to your specific requests.
What you get

Secure interface
Two-factor authentication for access to all of your data.

Daily updates
All data is refreshed every day through the official APIs.

No limit on providers
The platform adapts to your stack: ad platforms, analytics and back-office.

Bespoke reports
Beyond the standard set, reports built around your needs.
Everything about the dashboard
Which platforms can be connected to the dashboard?
The standard platform covers ad platforms (Google Ads, Meta Ads, Bing Ads, LinkedIn Ads, Pinterest Ads...), web analytics (GA4, Piano Analytics, AT Internet, Amplitude...) and the e-commerce back-office (Shopify, PrestaShop, Magento...). There is no limit on providers: it adapts to your existing stack.
How is access to my data secured?
The interface is protected by two-factor authentication. It brings all of your digital marketing data together in a single space, restricted to your teams and to authorised Snow Globe consultants.
How often is the data updated?
Daily, across every connected platform, from each source's official API.
Can I compare my performance across different periods?
Yes — comparison is flexible: period vs previous period, vs last year, or over a custom range, with the same filters throughout the interface.
Are the SEO vs SEA, Brand Monitoring and Meta Breakdowns reports available?
Yes, they are among the reports we build. Whether they are set up depends on the scope agreed together: your stack, your objectives and the engagement in place. We also produce additional bespoke reports as needed.
Does the dashboard replace Snow Globe's support?
No, it complements it: the dashboard grounds steering and budget arbitration, but remains inseparable from our consultants' expertise on your accounts.
Hundreds of clients advised since 2006


Géraldine Talec

Specialized expertise and business intelligence.
Benoît is a passionate expert in his field, who keeps a keen eye every sector of your business.
Snow Globe knows how to advise on best practices to quickly optimize every campaign on each platform, thus obtaining rapid and effective results.
We have been able to reduce our costs in light of increased performance. In a nutshell: Thank you!


Denis Fayolle

Highest levels of professionalism!
A big thank you to Snow Globe for setting up, monitoring, and optimizing our campaigns over time. It is great to have such a good quality service provider for SEA.

David Lindberg

Snow Globe has been working with us for 3 years now and has enabled us to significantly increase our online turnover.
Contact Us
SNOW GLOBE TOULON/ 6 Rue Molière - 83000 TOULON
SNOW GLOBE PARIS / Greenspace - 28. Rue du Chemin Vert 75011 PARIS
Email: contact@snowglobe.fr
WhatsApp / SMS +33 (0)6 07 69 11 64


